

Latin America will offer 46.9 million scheduled airline seats in September 2026, up 2.3% from a year earlier. The expansion, however, is increasingly uneven: domestic and intra-regional capacity continue to grow while the North American market has lost more than 400,000 seats. OAG data suggest that the next phase of regional aviation growth may be defined less by overall volume than by where new capacity is being deployed.
Latin America remains a growth market in September 2026, but the headline number hides an important shift. OAG counts 46.9 million scheduled seats across the region, compared with 45.9 million in September 2025. Domestic capacity has increased by 4% to 27.88 million seats, while international capacity has edged down by 0.1% to 19.05 million. The contrast suggests that regional aviation is still expanding, but not through the same markets or corridors.
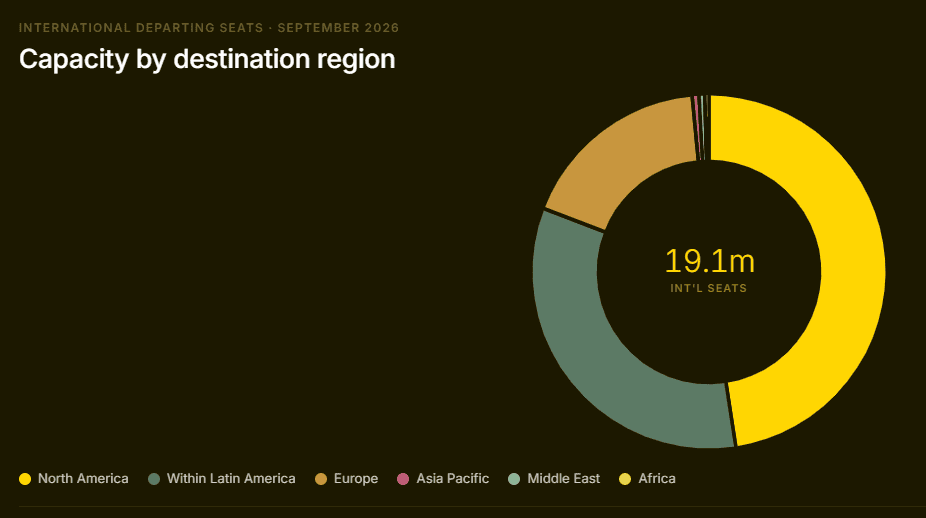
The September 2026 international figures become more revealing when capacity is broken down by destination region. North America remains Latin America’s largest international market with 9.07 million seats, but capacity has fallen by 4.2%, equivalent to 401,028 fewer seats than in September 2025. Intra-Latin American capacity has moved in the opposite direction, increasing by 3.4% to 6.34 million seats, while capacity between Latin America and Europe has grown by 4.1% to 3.36 million.
The loss of more than 400,000 North American seats is large enough to absorb much of the capacity added elsewhere. Intra-Latin American markets have gained almost 209,000 seats and European markets more than 132,000, while smaller markets including Asia-Pacific and Africa are also expanding from low bases. International capacity is therefore not weakening uniformly. The September 2026 data point instead to a redistribution of growth between major corridors.
Growth is moving south and inward
South America provides some of the clearest evidence of that redistribution. OAG reports that Lower South America will account for 17.8 million seats in September 2026, around one million more than a year earlier. Brazil remains Latin America’s largest aviation market with 12.53 million seats, up 5.3%, while Argentina records the fastest percentage increase among the largest country markets at 15.5%. Panama is also expanding strongly, with scheduled capacity up 11.5%.
Brazil’s domestic market alone will offer 11.1 million seats in September 2026, an increase of 5.6% or nearly 590,000 seats from September 2025. Brazil therefore illustrates how domestic scale can continue to support regional capacity growth even when parts of the international market are losing momentum. Mexico, by contrast, will have around 130,900 fewer seats overall than a year earlier, according to OAG.
Latin America’s airline rankings reinforce the same uneven pattern. LATAM Airlines Group remains the region’s largest carrier with 9.01 million seats in September 2026, up 4.7%, while GOL increases capacity by 10.4%. Copa Airlines records the fastest growth among the ten largest carriers at 15.5%, adding around 250,300 seats, and JetSMART follows with 14.9% growth. Aeromexico and VivaAerobus move in the opposite direction, reducing scheduled capacity by 2.3% and 1.7% respectively.
Latin America’s largest airports show a similar divergence. São Paulo Guarulhos, in Brazil, remains the region’s largest airport by scheduled capacity with 2.41 million seats in September 2026, while Panama City, Panama, grows by 12.3% and Buenos Aires Aeroparque, Argentina, by 14.6%.
Lima, Peru, increases by 7.7% and Rio de Janeiro Galeão, Brazil, by 8.2%. Cancún, Mexico, stands out in the opposite direction, with capacity falling by 12.3% and almost 130,000 seats compared with September 2025.
The US–Mexico market helps explain the North American decline
The US–Mexico market offers one of the clearest examples of what is changing between Latin America and North America. OAG estimated in July 2026 that US-based airlines would operate around one million fewer seats to Mexico during summer 2026 than during summer 2025. American Airlines had removed nearly 170,000 seats year on year, while Alaska Airlines had reduced capacity by around 240,000 seats, or 38%.
Mexico’s leisure destinations have absorbed some of the largest reductions in US capacity. Scheduled US capacity to Cancún falls by 15.5% between summer 2025 and summer 2026, while Puerto Vallarta declines by 29.6% and San José del Cabo by 16.6%. Mexico City increases by 2.3%, Guadalajara by 7.4% and Querétaro by 24.6% over the same period. The US–Mexico adjustment therefore does not represent a uniform withdrawal from Mexico; capacity is being redistributed between different types of destinations.
The competitive balance on the US–Mexico corridor is changing at the same time. Mexican-domiciled airlines account for 40% of scheduled capacity in summer 2026, compared with 34% in summer 2024. OAG links part of that change to fleet growth among Mexican low-cost carriers and the capacity reductions made by US airlines. The result is not simply a smaller market in some segments, but a different distribution of capacity between operators.
Scheduled seats are only part of the picture
OAG’s September 2026 schedules should not be read as evidence that international demand across Latin America is broadly declining. International Air Transport Association data for July 2026 show that Latin American airlines recorded a 7.1% year-on-year increase in international revenue passenger kilometres, while international capacity measured in available seat kilometres increased by 7.2%. North American airlines, by comparison, recorded a 2.3% decline in both international demand and capacity during July 2026.
Airlines in Latin America and the Caribbean had already faced a more difficult traffic environment earlier in 2026. The Latin American and Caribbean Air Transport Association reported 37.3 million passengers in June 2026, down 2.3% from June 2025 and the region’s first monthly year-on-year decline since 2021.
Available seat kilometres still increased by 0.9%, while revenue passenger kilometres fell by 1% and the average load factor declined to 81.6%. The first half of 2026 nevertheless remained positive, with 242.8 million passengers, up 3.4% year on year.
The combination of OAG, IATA and ALTA data therefore points to a more nuanced market than either “continued growth” or “international slowdown” would suggest. Latin American aviation is still expanding in aggregate, but capacity growth is becoming more selective across domestic markets, international corridors, airlines and airports.
North America is currently the main weak point in scheduled international capacity, while intra-regional connectivity, Europe and several South American markets continue to add seats.
Latin America’s next phase of aviation growth may therefore depend less on how many seats the region adds overall than on which markets, hubs and corridors capture them. September 2026 shows a region where domestic scale remains powerful, intra-Latin American capacity is expanding and major South American operators are growing, even as the region’s largest international corridor contracts.
For airports and airlines, understanding that changing growth map may become more valuable than watching the regional headline alone.
Sources: OAG, Latin American Aviation Market – September 2026; OAG, One Million Seats Gone: The Forces Reshaping US-Mexico Aviation, 29 July 2026; ALTA, Air Traffic in Latin America and the Caribbean – June 2026, 14 August 2026; IATA, Air Passenger Market Analysis – July 2026, 31 August 2026.
How many airline seats are scheduled in Latin America in September 2026?
OAG reports 46.9 million scheduled seats in September 2026, up 2.3% from September 2025.
Is international airline capacity declining across Latin America?
Total international capacity is down only 0.1% year on year. The result masks growth within Latin America and toward Europe alongside a 4.2% decline toward North America.
Which international market has lost the most capacity?
North America has lost 401,028 scheduled seats from Latin America compared with September 2025, the largest absolute decline among OAG’s destination regions.
Is declining scheduled capacity the same as declining passenger demand?
No. Scheduled seats measure planned airline capacity, while passenger traffic and RPK data measure actual travel activity. IATA reported international demand among Latin American airlines up 7.1% in July 2026 despite the different capacity pattern visible in OAG’s September schedules.