

Measured by scheduled seats, flights within Latin America and the Caribbean (LAC) form the region’s largest international market. Measured by where passengers actually travel, the United States comes first. The finding comes from Regional Connectivity and Market Power in Latin America and the Caribbean, the study commissioned by Airports Council International – Latin America and Caribbean (ACI-LAC) and carried out by GPA and the Universitat de Barcelona. This second article in the LATITUDE 15 series looks at the gap between seats and passengers, and at the hubs where passengers change planes.
Two Ways to Measure the Same Market
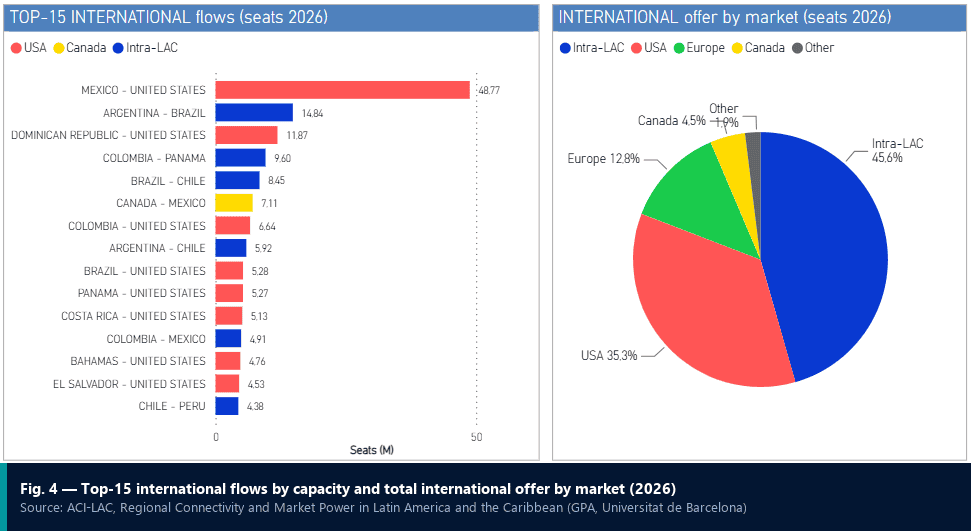
Airline schedules and passenger journeys do not paint the same picture. Measured by scheduled seats, routes within the region are LAC’s largest international market in 2026, with 45.6% of international capacity, ahead of the United States at 35.3%.
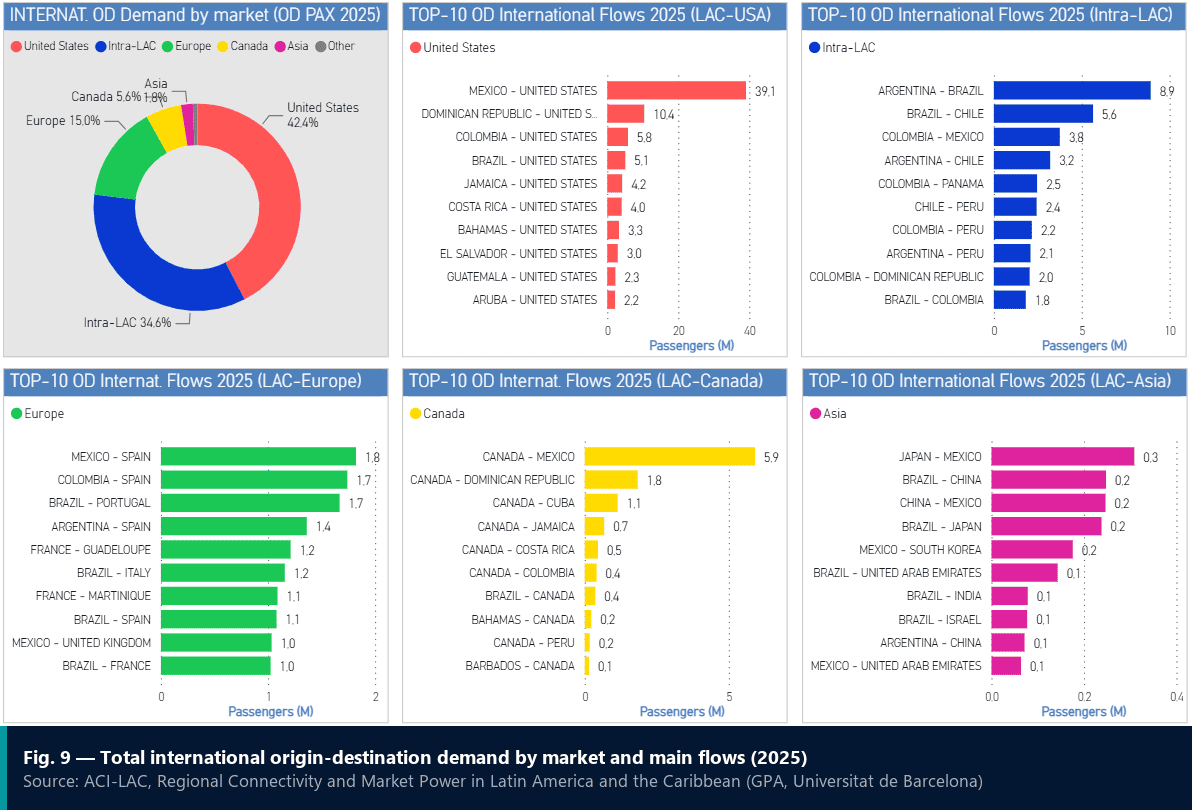
The study also uses origin-and-destination (O&D) data, which follow each passenger from the true start of the trip to its final destination, whatever the connections in between. On that basis, the order is reversed: in 2025, the United States accounted for 42.4% of LAC’s international passenger demand, against 34.6% for flows within the region. Europe followed with 15.0%, Canada with 5.6% and Asia with 1.8%. The authors stress that this gap between supply and demand shows why passengers’ true destinations matter, particularly in markets with heavy connecting traffic.
Nearly One Passenger in Four Changes Planes
Across LAC, 76.1% of O&D passengers reached their final destination on a non-stop flight in 2025, which means 23.9% needed at least one connection. The share of non-stop journeys falls to 57.7% for travel outside the region. The next article in the series looks at these figures country by country.
Where Passengers Change Planes
For connecting journeys within the region, four airports handle more than half of the flows: Panama City-Tocumen, Bogotá, Lima and São Paulo-Guarulhos. Journeys to and from the rest of the world spread across a wider set of hubs, led by Miami (9.7% of indirect extra-LAC journeys), Madrid (7.7%), Atlanta (7.3%), Houston (6.7%) and Dallas/Fort Worth (5.5%), followed by Panama City (4.8%), São Paulo-Guarulhos (4.7%) and Paris-Charles de Gaulle (3.3%).
The more distant the market, the more passengers depend on connections, the study notes. North America represents 73.3% of extra-LAC demand and has the highest share of non-stop journeys (64.7%). Travel to Western Europe splits almost evenly between non-stop (45.2%) and one-stop (44.7%) itineraries, while only 9.5% of passengers between LAC and the Far East fly non-stop.
What the Study Recommends
Strengthening international connectivity is one of the study’s four strategic priorities. The authors observe that LAC’s largest hubs handle a relatively small share of long-haul traffic. They point to policies that encourage additional long-haul services and the integration of regional network carriers into global alliances, including metal-neutral joint ventures where appropriate, as ways to reinforce the role of these airports in global networks.
Questions to Ask
Airports
- Do you know where your passengers are really going, beyond the first flight out?
- For your main markets, what share of passengers connect, and through which hub?
Tourism boards and destinations
- Which hubs do your visitors pass through, and are those hubs part of your marketing?
Airlines
- Which large O&D flows from your network still travel through another carrier’s hub?
About the Data
Passenger figures are 2025 origin-and-destination (O&D) data; seat figures refer to 2026 scheduled capacity. O&D data follow each passenger from the true origin of the trip to its final destination. Source: ACI-LAC, Regional Connectivity and Market Power in Latin America and the Caribbean, Deliverable 3 – Final Report, prepared by GPA and the Universitat de Barcelona.
Previously in the series: 653 fewer airport pairs than in 2019. Next: how many passengers fly non-stop, country by country.