The Caribbean/Bahamas/Bermuda remained the world’s largest cruise destination region in 2025, welcoming 16.27 million cruise passengers, up 8.4% from 15.01 million a year earlier. That meant more than 1.25 million additional visitors in a single year, with 44% of global cruise passengers sailing in the region.
For Caribbean ports, that growth creates an obvious opportunity. But the commercial question is no longer simply how many passengers can be accommodated. It is how effectively each call is converted into spending — and how much of that value ultimately stays in the destination.
Passenger volume is only the first KPI
The latest comparable FCCA/BREA study, covering 33 Caribbean and Latin American destinations during the 2023/2024 cruise year, measured US$4.27 billion in direct cruise-related expenditure. Passengers generated US$3.07 billion from 29.4 million onshore visits, with average spending of US$104.36 per passenger visit.
That regional average hides important differences. Passenger spending averaged US$120.93 in The Bahamas, US$84.95 in St. Lucia and US$82.39 in Antigua & Barbuda.
The difference matters because an arriving passenger is not automatically a spending passenger. Across the destinations surveyed, the average disembarkation rate for transit passengers was 83%. The economic funnel therefore starts before the first purchase: passengers arrive, some go ashore, some buy excursions or goods, and only then does spending reach businesses in the destination.
Ports are moving closer to the passenger wallet
Nassau shows how infrastructure strategy is responding.
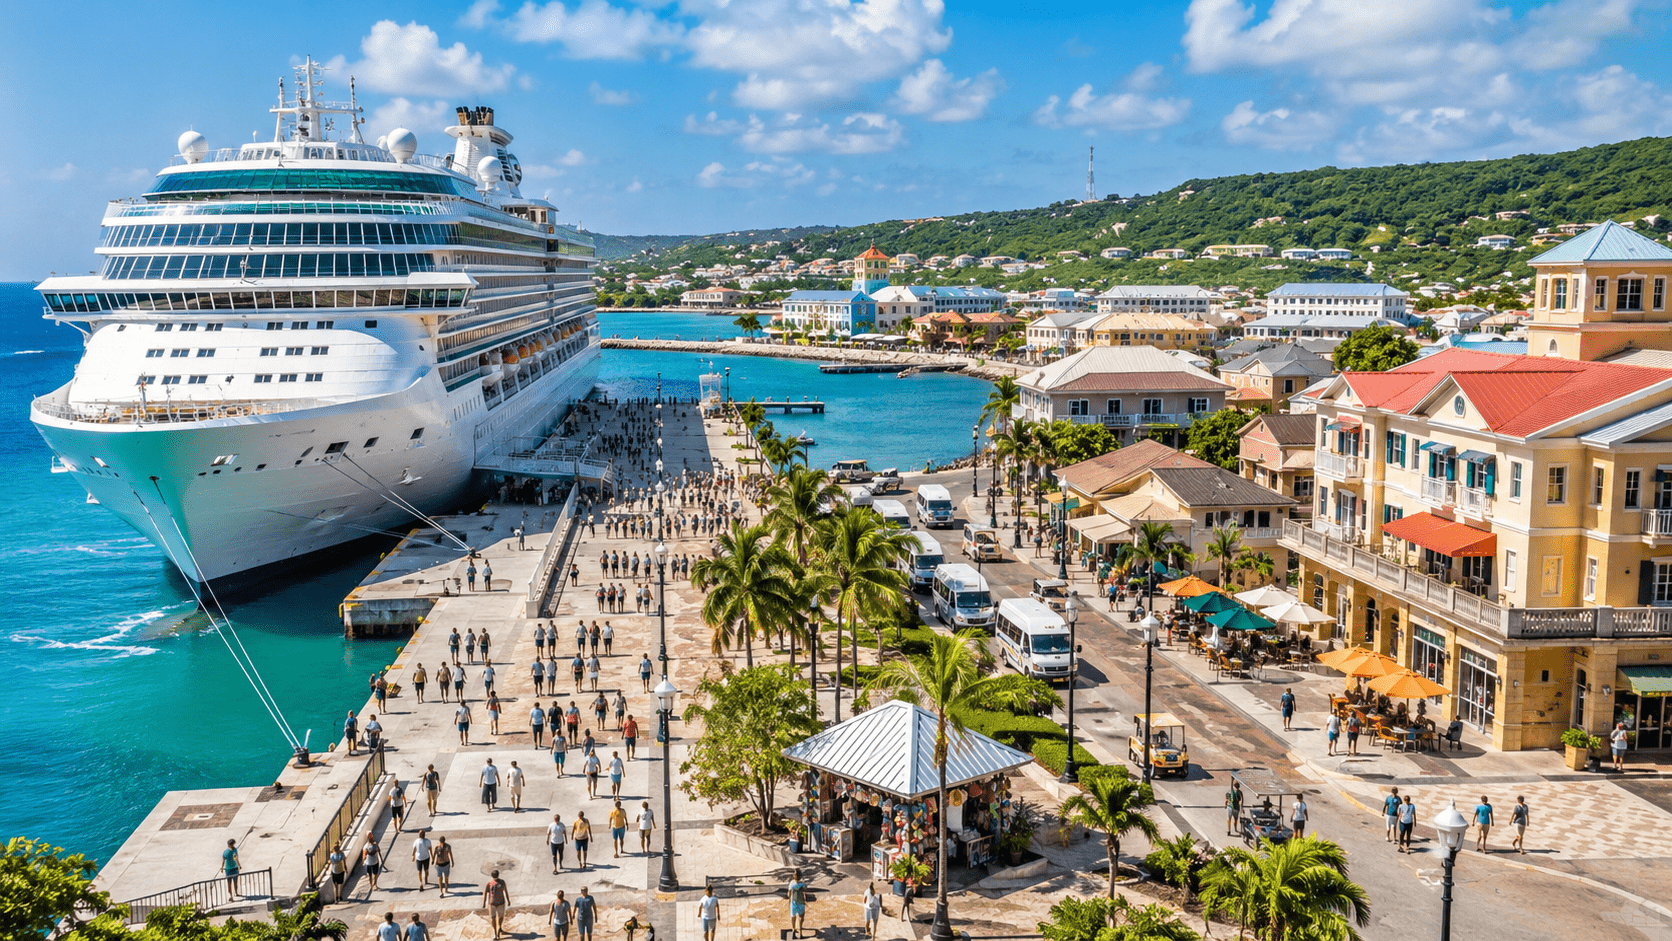
Its US$300 million waterfront redevelopment expanded berthing capacity, but also added more than 60 retail outlets, food and beverage concepts, a Junkanoo museum, an amphitheatre and other commercial and cultural spaces. On June 8, 2026, Nassau Cruise Port welcomed a record 33,254 passengers from six ships in a single day.
A volume of that size makes the commercial challenge visible. The berth creates footfall; the landside product determines how much of that footfall becomes expenditure.
Antigua is pursuing a related model. Its new purpose-built cruise terminal, unveiled in early 2026, was designed to strengthen homeporting and turnaround operations. Cruise activity had already climbed from 81,395 passengers and 124 calls in 2021 to 808,345 passengers and 436 calls in 2025.
The wider Upland Development is designed to add around 50,000 square feet of retail, food and beverage and other commercial space, including opportunities for local entrepreneurs.
The logic is straightforward: if passenger flows can be placed directly alongside local products, services and experiences, ports have a better chance of converting traffic growth into destination-level revenue.
The port-city connection also matters
Capturing spending does not necessarily mean keeping passengers inside a port-controlled commercial zone.
St. Lucia illustrates the other side of the equation. The current Saint Lucia Cruise Port development includes plans for a new Vendors Arcade, a Fishermen’s Village giving priority to local vendors and a boardwalk intended to improve connectivity between Pointe Seraphine and Castries.
The FCCA/BREA data help explain why that physical connection matters. During the 2023/2024 cruise year, 757,795 cruise passengers arrived in St. Lucia and an estimated 646,400 — 85% — went ashore. Those visitors spent an average of US$84.95 each.
Their time was also limited. The typical cruise party spent around five hours ashore. More than seven in ten passengers purchased a shore excursion, while 57% made at least one other purchase ashore. Shore excursions, watches and jewellery, and clothing accounted for 81% of passenger expenditure.
For a destination, five hours is a short commercial window. Walkability, transport, the location of shops and attractions and the ease of moving between the port and the city can influence how much spending fits inside it.
Not every passenger represents the same opportunity
Headline passenger figures can also conceal different economic models.
A transit passenger may spend a few hours ashore. A homeport passenger can generate airport transfers, hotel nights, restaurant spending, baggage services and pre- or post-cruise activity before the ship even sails.
That is why Antigua’s homeporting strategy matters beyond terminal operations. Its new terminal was specifically designed for homeporting and turnaround activity, potentially extending cruise-related demand into aviation, accommodation and ground transport.
Crew represent another market. So do passengers travelling independently rather than through organised excursions. Simply dividing total expenditure by total passengers therefore cannot explain where the strongest commercial opportunities actually sit.
The next KPI is locally captured value
Passenger numbers will remain central to port planning. Spend per passenger is a better commercial metric. But the next question is harder: how much of that expenditure becomes locally retained value?
That means looking beyond gross visitor spending toward local ownership, employment, sourcing, taxes and the participation of domestic businesses. A destination can report strong passenger expenditure while still needing to understand where the money flows after the transaction.
The industry itself is moving toward more detailed measurement. In 2026, Tourism Economics launched a new series of cruise impact studies across more than 30 Caribbean and Latin American destinations, including work intended to help destinations understand how to maximise passenger and crew spending. The first results are due at the 2027 FCCA Cruise Conference and Trade Show.
Caribbean ports will continue to compete for ships and passengers. But with regional cruise volumes still expanding, another competition is becoming more important: converting each arrival into sustainable economic value ashore.
The strongest cruise destination may ultimately not be the one receiving the most passengers, but the one that makes each visit count.