

Aircraft with fewer than 100 seats offered around 40 million seats in Latin America and the Caribbean (LAC) in 2026, against approximately 70 million in 2019. Their share of scheduled capacity has halved, from 11.8% to 5.8%. According to the study, these aircraft still play a particularly important role in connecting smaller airports, and the Caribbean is where they fly the most. This fourth article in the LATITUDE 15 series on Regional Connectivity and Market Power in Latin America and the Caribbean, the study commissioned by ACI-LAC and carried out by GPA and the Universitat de Barcelona, looks at regional aviation.
Regional Aviation Has Not Caught Up
The study defines regional aviation as scheduled flights operated with aircraft configured with fewer than 100 seats. Its post-pandemic recovery has been significantly slower than that of the overall market. Regional flights fell from approximately 1.3 million in 2019 to 0.9 million in 2026, and their share of all scheduled operations from 29.8% to 20.9%. According to the authors, the post-pandemic expansion of the LAC market has been driven primarily by narrow-body aircraft.
Measured in flights rather than seats, the segment still weighs much more: one scheduled flight in five in LAC is operated with a regional aircraft, against 5.8% of seats.
The Caribbean Flies the Most Regional Flights
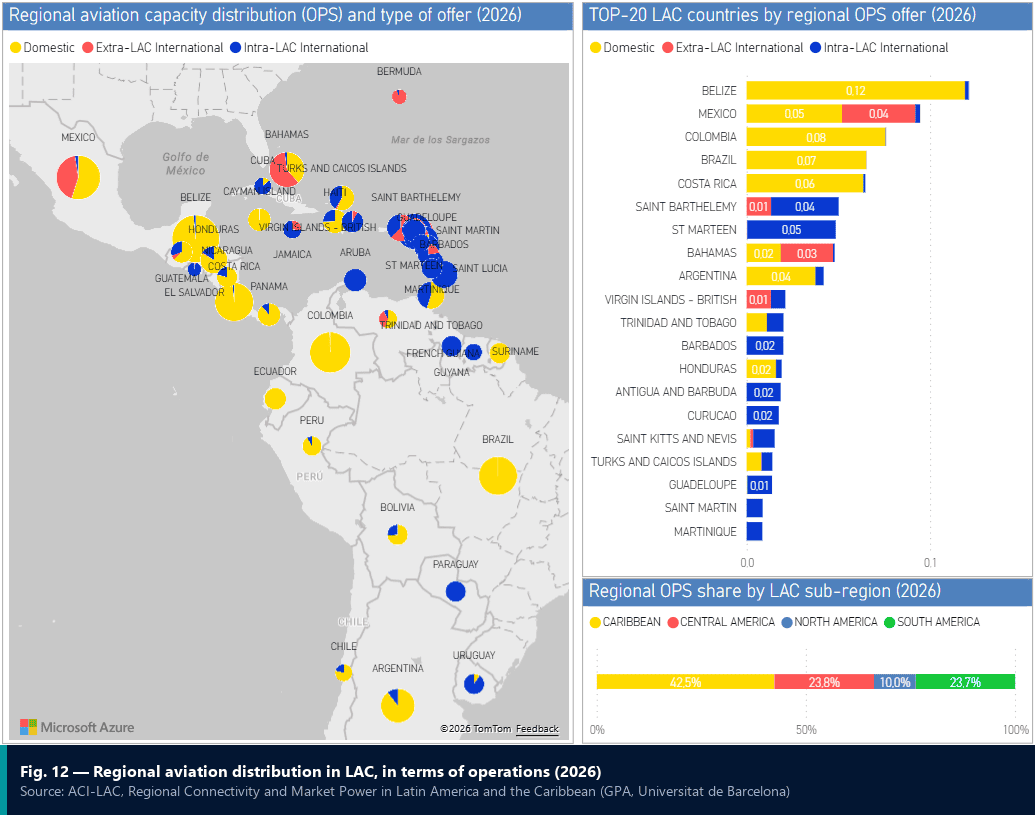
The Caribbean accounts for 42.5% of all regional aircraft operations in LAC, ahead of Central America (23.8%), South America (23.7%) and Mexico (10.0%). In seats, it also comes first, with 35.1%. Belize is the largest single market by number of regional flights, almost all of them domestic. Colombia, Brazil and Costa Rica also rank among the largest.
The use differs by area. In the Caribbean, regional aircraft mainly fly international routes within the region, connecting island states and territories. In South and Central America, domestic services dominate. Mexico combines a domestic network with flights to the southern United States.
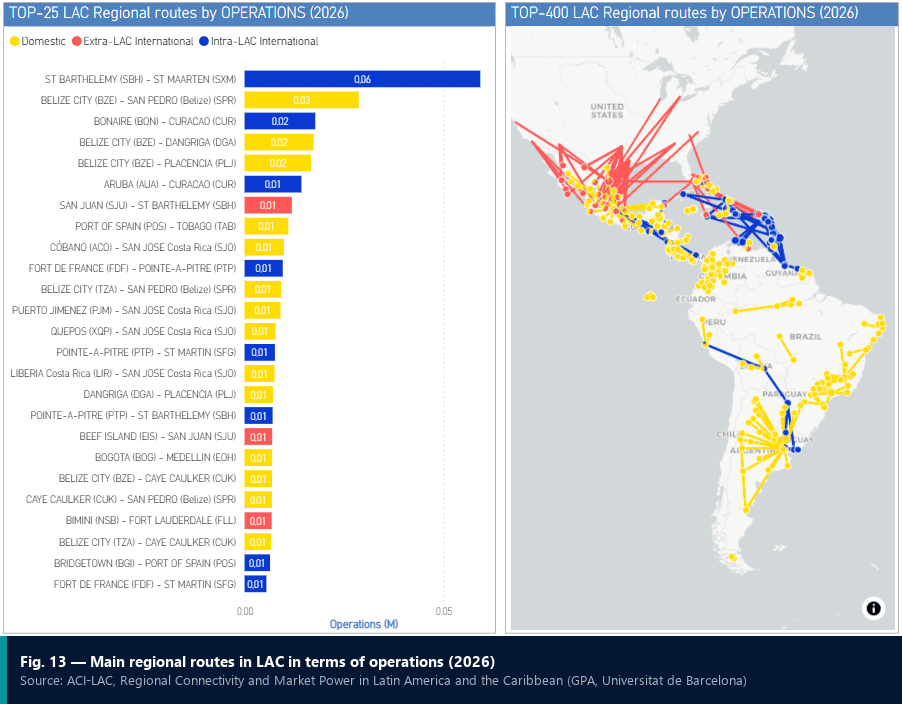
The study’s ranking of the 25 busiest regional routes by number of flights in 2026 is led by St Barthélemy–Sint Maarten. Several other Caribbean routes appear in it, including Bonaire–Curaçao, Aruba–Curaçao, San Juan–St Barthélemy, Port of Spain–Tobago, Fort-de-France–Pointe-à-Pitre, Pointe-à-Pitre–Saint-Martin (Grand Case), Pointe-à-Pitre–St Barthélemy, Bridgetown–Port of Spain and Fort-de-France–Saint-Martin (Grand Case).
Relative to population, regional aviation is particularly limited in Peru, Venezuela, Chile and Ecuador. The authors specify that this does not necessarily mean the level of service is insufficient.
Short Hops and Small Aircraft
More than 80% of regional flights cover less than 500 km. The average stage length is 325 km on domestic services and 335 km on international routes within the region, against 933 km for services leaving the region, mostly between Mexico and the United States.
Commuter aircraft with fewer than 20 seats, such as the Cessna Caravan, perform 42.5% of regional operations. Medium regional aircraft of 50 to 79 seats follow with 27.8%, small regional aircraft of 20 to 49 seats with 17.4% and large regional aircraft of 80 to 99 seats, such as the Embraer E-Jets, with 12.2%. ATR 42 and ATR 72 turboprops are typical of the small and medium categories.
Two operating models coexist. Specialised carriers such as Maya Island Air, Winair, SANSA and Tropic Air lead by number of flights, with high-frequency services on small aircraft. Measured by seats, Aeroméxico, Aerolíneas Argentinas, Azul and Clic come first, with larger regional aircraft serving busier domestic and feeder markets.
The Link Between Secondary Airports
The study classifies airports offering more than 5 million seats a year as primary airports and the others as secondary. On international routes within LAC flown with regional aircraft, 50.3% of airport pairs link two secondary airports and 46.0% link a primary and a secondary airport. Only 3.7% link two primary airports: more than 96% of these pairs involve at least one secondary airport.
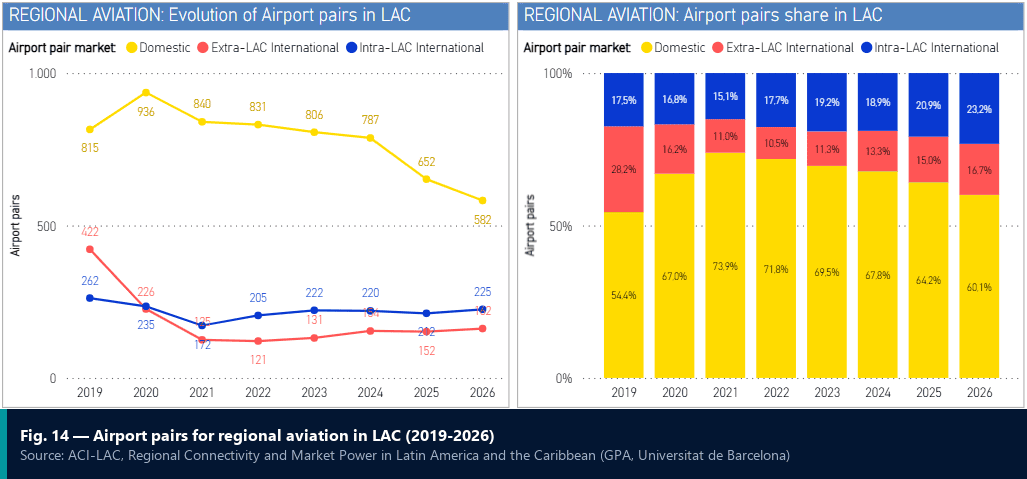
The regional network has nonetheless shrunk across all segments since 2019. The most significant contraction concerns routes leaving the region, largely because of fewer links with the United States: 419 airport pairs served with regional aircraft in 2019, 157 in 2026. Routes within LAC now account for 58.1% of international airport pairs flown with regional aircraft.
How LAC Compares
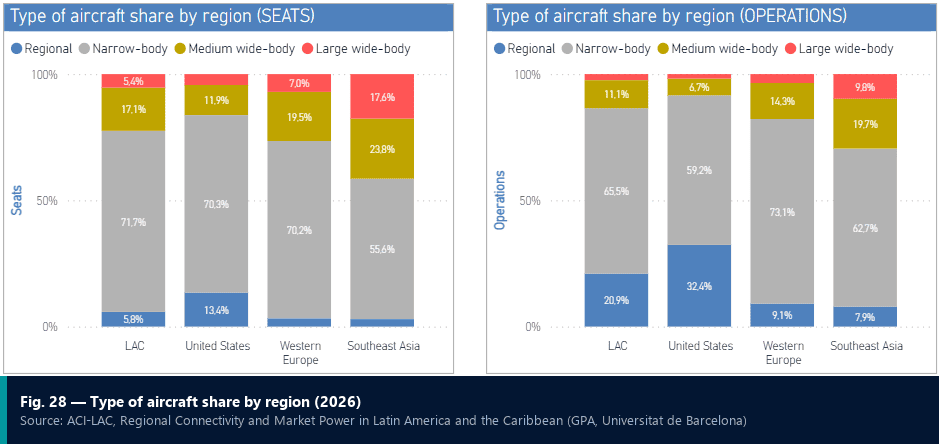
Regional aircraft account for 13.4% of seats and 32.4% of flights in the United States, against 3.3% and 9.1% in Western Europe and 3.0% and 7.9% in Southeast Asia. LAC sits in between. Its regional network covers approximately 925 airport pairs, against 2,844 in the United States, 1,154 in Western Europe and 355 in Southeast Asia. The scale of operators also differs: a regional airline in LAC performs 14,139 regional flights a year on average, against 57,659 in the United States and 16,972 in Western Europe.
What the Study Recommends
Strengthening connectivity across secondary and smaller airport markets is one of the study’s four strategic priorities. The authors cite appropriate airport incentive schemes, proportionate regulatory frameworks and operating conditions adapted to smaller aircraft and markets, to help thinner routes develop and last. They add that the United States illustrates what regional aviation can bring to a more interconnected airport system, while any approach in LAC should reflect the geography and markets of each subregion.
Questions to Ask
Secondary and island airports
- Which of the regional routes you had in 2019 are still flown in 2026?
- Are your charges and incentives designed for aircraft with fewer than 100 seats?
Civil aviation authorities and governments
- Are the regulatory requirements applied to small aircraft and thin routes proportionate to their size?
Tourism boards and destinations
- How many of your visitors reach you on a regional flight from a larger gateway, and from which one?
About the Data
Regional aviation: scheduled operations with aircraft configured with fewer than 100 seats. Primary airports: more than 5 million annual seats; secondary airports: below that threshold. Figures for 2026 are based on scheduled services. The route ranking is read from the study’s chart (Fig. 13). Source: ACI-LAC, Regional Connectivity and Market Power in Latin America and the Caribbean, Deliverable 3 – Final Report, prepared by GPA and the Universitat de Barcelona.
Previously in the series: airport pairs, real passenger demand and non-stop travel. Next: competition on LAC routes.